According to UOB analysts, the New Zealand Dollar (NZD) could test the 0.6115 level, provided it stays below 0.6185. However, a significant break below this level isn't expected at the moment. In the longer term, if NZD does manage to drop below 0.6115, it could potentially move further towards 0.6085. Earlier today, NZD traded between 0.6129 and 0.6164, ending mostly unchanged at 0.6150. Despite the quiet movement, the overall trend remains slightly weak, suggesting a possible test of lower levels before a recovery.
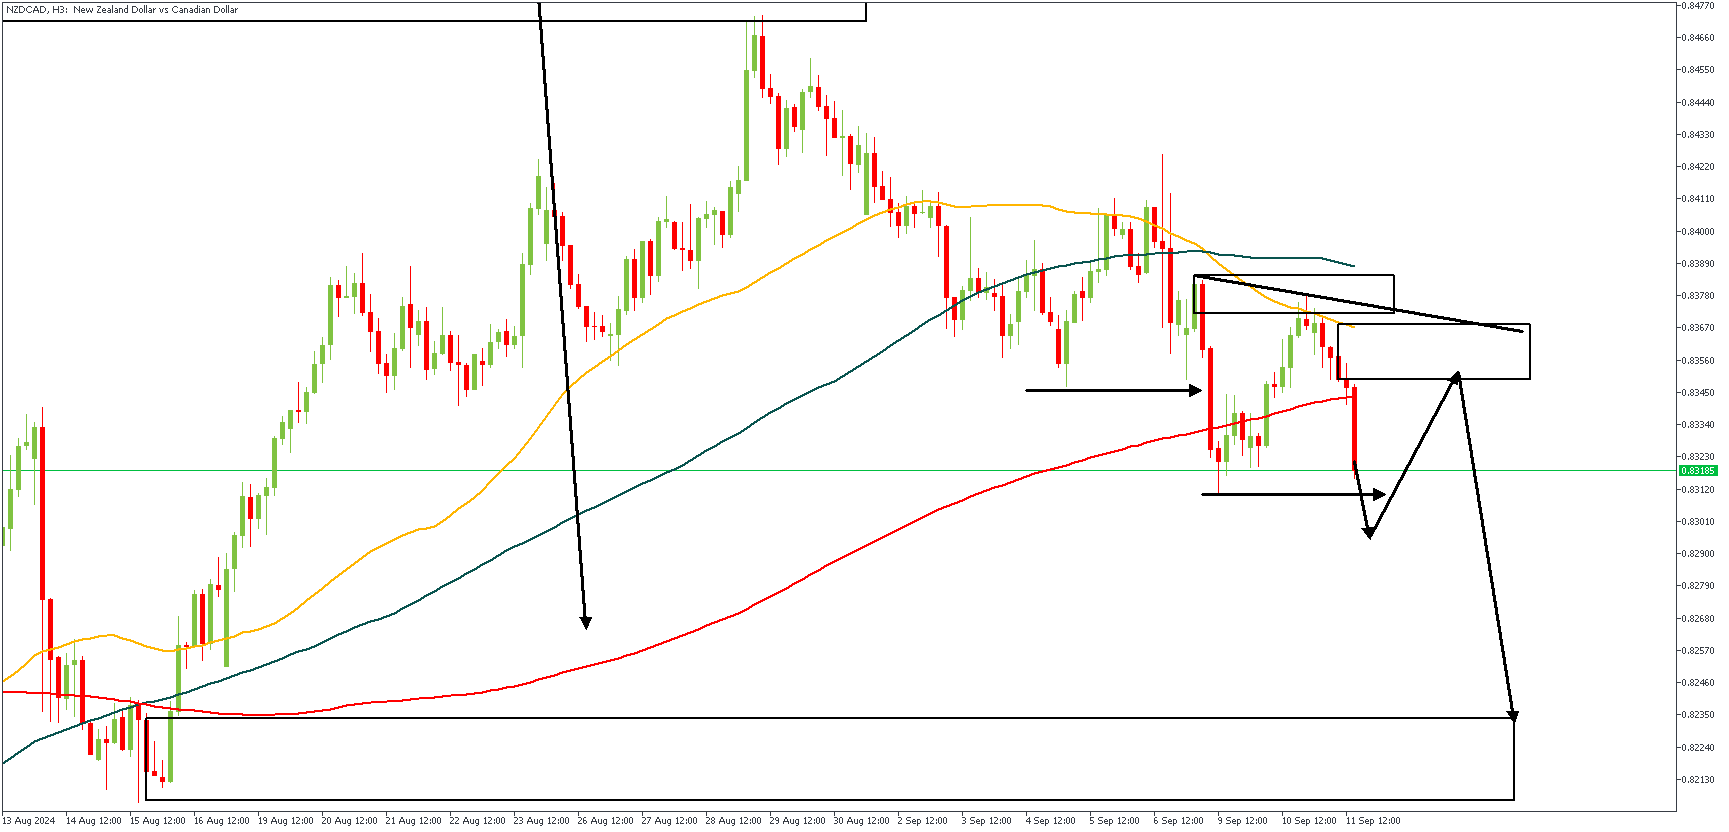
NZDCAD – H3 Timeframe

The price action on the 3-hour timeframe chart of NZDCAD shows that price has recently formed two new lows after sweeping off the previous lows; thereby establishing a bearish trend. Confirming this further is the crossing of the 50-period SMA below the 100-period SMA. My area of interest for an entry, however, is the highlighted supply zone, since it fits perfectly with the 76% of the Fibonacci, as well as the trendline resistance.
Analyst’s Expectations:
Direction: Bearish
Target: 0.82350
Invalidation: 0.83890
NZDUSD – H3 Timeframe
.png)
NZDUSD as seen, has just broken below the pivot zone on the daily timeframe after crossing below the 100-period SMA on the 3-hour timeframe. Therefore, it is my belief that price is headed for the highlighted demand zone around the 0.60100 region, or 0.60500 price region at the very least.
Analyst’s Expectations:
Direction: Bearish
Target: 0.60125
Invalidation: 0.61877
CONCLUSION
You can access more of such trade ideas and prompt market updates on the telegram channel.
